
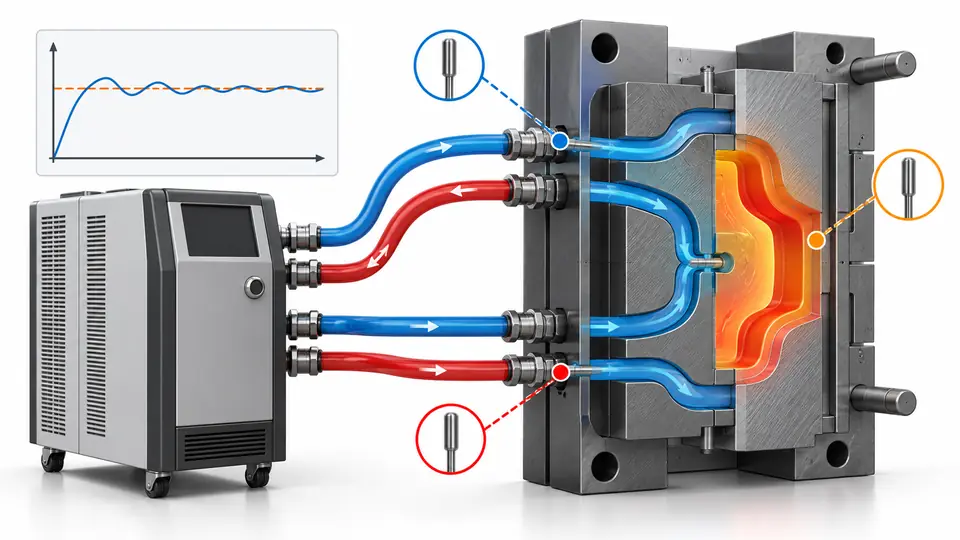
Two molding cells can both display the same mold-temperature setpoint while one cavity surface is cooler, less uniform or still warming. Hose routing, flow, coolant, scale, sensor location, ambient loss and cyclic melt heat all sit between the controller and the plastic.
Record the controller setpoint, but qualify the process with actual supply/return conditions, circuit flow and cavity-surface temperatures at defined locations and cycle timing. Establish the stabilized thermal map associated with acceptable parts. On transfer or restart, reproduce the relevant thermal response rather than assuming one displayed number is equivalent.
Name the temperature being discussed
“Mold temperature” may refer to controller setpoint, controller sensor, supply, return, bulk steel or cavity surface at a particular moment.
The distinction is not pedantry — it is how the sources treat the subject. LANXESS’ processing guide for Durethan and Pocan gives temperature control of the mold its own section (§2.7), treating mold temperature as a controlled process input with supply, return and steel temperatures to manage, not as a controller display value. RJG’s "Four Plastics Variables" — melt temperature, flow rate, pressure, and cooling (rate and time) — treat mold temperature as a variable to force and measure, not a setpoint to copy. A controller setpoint appears in neither list as a measurement: it is an input to the temperature-control unit, and the filled thermal map in this guide is the evidence of what it actually produced.
Define each measurement location, sensor, method and timing. Use cavity-surface temperature where the resin and surface response depend on it, while retaining coolant and controller data for diagnosis.
A controller typically regulates fluid in its own loop, not every point on the cavity. Supply temperature can change along hoses and manifolds; return integrates heat from the circuit. Steel near a gate can warm after injection and cool before the next shot. Contact probes, embedded sensors and infrared methods have different response and emissivity/contact limitations. Draw the points on a mold diagram and specify whether readings occur before startup, immediately after ejection or at a stable cycle phase.
Build the review around measurement-point map, sensor method, timing and controller/supply/return/surface definitions. The decision is whether all parties can reproduce the same temperature measurement rather than compare different physical quantities. Embedded sensors improve repeatability but add tool cost; disciplined portable measurements can support setup if location and timing are controlled.
Trace heat through the complete circuit
The same setpoint can produce different steel temperatures when flow, hose loss, coolant, manifold balance or deposits change.
Record controller capacity, coolant type, hose and manifold routing, circuit connection, flow and pressure where available, supply/return temperatures and maintenance state. Verify each circuit rather than only total flow. Use cooling-circuit hardware acceptance to verify identification, flow and leakage before interpreting the thermal response.
Series and parallel routing distribute heat differently. A reversed or partially blocked circuit may still show a plausible return temperature. Long uninsulated hoses lose heat. Scale or corrosion changes heat transfer while the controller display remains steady. Confirm baffles and bubblers are intact and vents are purged of air. A cooling-circuit flow test at tool acceptance supports mechanical condition; this article adds the thermal response under molding load. Keep circuit labels consistent with the setup sheet.
The working record should contain circuit diagram, connection check, coolant, flow/pressure, supply/return readings and maintenance history rather than a conclusion copied into email. Review the source, revision, units, sample selection and boundary conditions, then test whether the controller is connected to a known hydraulic and thermal path with no hidden inactive or imbalanced circuit. Higher flow can improve heat transfer until the system or tool limits intervene; increasing setpoint cannot compensate reliably for blocked flow.
Wait for a defined stabilized thermal state
Cold-start samples and steady production can have different dimensions and appearance even with unchanged settings.
Track selected surface and coolant readings with process signals and parts in time order. Define stabilization from the relevant trend and product checks, not a fixed number of cycles copied from another mold.
Large molds, hot runners, inserts and asymmetric cooling can stabilize at different rates. The melt adds heat cyclically, so no-load warmup may not reproduce production equilibrium. Measure at the same cycle phase to avoid mistaking normal oscillation for drift. Compare part weight, dimensions, gloss or warpage where thermal state influences them. Hold startup production until the established criteria are met. A restart after a brief stop may need a different rule from a full cold start.
Ask the supplier to connect time-ordered surface/supply/return temperatures, cycle state and correlated part characteristics to the proposed part and production state. The evidence is sufficient only when release begins only after the thermal trend and relevant product outputs reach the approved state. Long warmup protects consistency but creates scrap and downtime; evidence can define a repeatable minimum instead of habit.
Map spatial variation across the mold
One reading near a convenient corner can miss a hot gate, cold core or cavity-to-cavity imbalance.
Select measurement locations from geometry, gate, cooling layout and quality risk. Compare fixed/moving halves, critical cores, cavities and inlet/outlet ends under the same cycle condition.
A sensor housing seal land, long cosmetic face and thick boss may respond to different steel zones. Multi-cavity tools need cavity identity. Use a marked map and repeatable contact or embedded locations. For infrared measurements, control surface condition, viewing angle and emissivity limitations; shiny steel can mislead. Do not average away a localized difference that maps to a defect. When the tool is modified or a water circuit cleaned, repeat the map and correlate it with parts.
Use risk-based thermal map, cavity/half identity, repeated readings and corresponding dimensional/appearance results to challenge the preferred option. The release test is whether localized thermal differences relevant to quality are visible and within the approved evidence range. More points improve diagnosis but slow manual checks; retain routine points that best detect the proven failure modes.
Transfer thermal response, not the displayed recipe
A new press, controller, plant water system or ambient condition can change actual mold temperature with the old setpoint. process-window guide shows how to re-establish the window on the new press instead of copying the setpoint.
Match hose/circuit configuration and coolant first, then compare measured thermal map and part response. Adjust the receiving controller within material and tool limits to reproduce the approved state.
Controllers differ in heater/cooling capacity, sensor calibration, pump curve and control logic. Plant supply and ambient conditions also change heat rejection. Covestro guidance notes actual in-mold sensing may be used to correct the medium input temperature. Record both old and new systems and avoid presenting the adjusted setpoint as a product specification. If matching the thermal state requires operation beyond equipment limits, the cell is not equivalent and needs engineering review.
Before closing this point, reconcile sending/receiving controller data, circuit setup, measured thermal maps and matched process/part outputs with the controlled product definition. The reviewer should be able to show that the receiving cell reproduces the relevant cavity thermal state rather than merely copying a setpoint. Exact hardware duplication simplifies setup but does not remove maintenance and ambient variation; measured response provides the transferable reference.
Create reaction limits linked to product risk
Temperature records add little value if operators do not know when to hold parts, inspect circuits or adjust within an approved range.
Set monitoring points and limits from validated evidence, define the reaction sequence and affected-product boundary, and require review before changing a limit or measurement method.
A high return temperature may indicate load, low flow or another cause; the reaction should verify connections, flow and sensors before changing setpoint. Define how many cycles or containers are held after an alarm. Reinspect the characteristics correlated with the thermal deviation. Calibrate or verify instruments on the required schedule. Trend data by mold and cell so gradual fouling can be distinguished from a sudden hose error. Update setup and maintenance records after correction.
Release from this stage should cite validated temperature ranges, alarm/reaction plan, instrument control and product containment rule and explain why thermal deviation is detected, diagnosed and contained before unverified product is released. Narrow limits may create nuisance stops if normal cyclic and measurement variation were not characterized; broad limits may miss meaningful drift.
Mold thermal-state transfer sheet
Record the physical thermal state beside the machine recipe.
| Review line | Input or evidence | Decision or action |
|---|---|---|
| Definitions | Setpoint, supply, return, steel/surface and cycle timing | Compare like quantities |
| Hardware | Controller, pump, coolant, hoses and manifold | Identify system differences |
| Circuits | Routing, flow/pressure and maintenance condition | Confirm heat path |
| Stability | Warmup trend and correlated part outputs | Define release point |
| Spatial map | Critical locations, cavities and mold halves | Detect imbalance |
| Reaction | Limits, checks, holds and requalification | Control deviations |
Keep the thermal sheet with the mold setup and revision history. A setpoint should remain an equipment input; the evidence range for actual mold response is the transferable process reference.
Applying the method to a defined situation
A mold moves to another press with the same controller setpoint. Parts show a different gloss and seal-land dimension. The team finds that the receiving cell uses longer hoses and one parallel circuit has lower flow. It restores the circuit, maps cavity-surface temperature at the same cycle phase, and adjusts the controller only after the hydraulic path is correct. Parts are released when both the thermal map and correlated characteristics match the approved range.
This illustrative scenario is not a customer case.
Questions for the supplier review
- Which physical temperature does each displayed or measured value represent?
- Where and when are cavity-surface readings taken?
- Are circuit routing, coolant and flow equivalent?
- What trend defines stable startup?
- Which locations correlate with the critical part outputs?
- What is the hold and reaction plan for a thermal deviation?
Information to submit for a project-specific review
Provide mold/circuit drawings, controller and coolant details, hose/manifold setup, material processing guidance, existing temperature readings, cycle and defect data, critical part characteristics and transfer objective. Submit these inputs through the AutoMoldingPro request form. Mark unresolved points as assumptions so they can be priced and closed before tooling or production commitment.
Conclusion
Use controller setpoint as one input, not proof of mold temperature.
A filled thermal map for one mold, at one stated moment in a stable cycle. All readings are assumed for illustration (not an AutoMoldingPro measurement); the method, not the numbers, is the deliverable. The setpoint is the same for all three circuits — the map is what shows they are not the same mold temperature.
| Circuit | Location | Supply | Return | ΔT (return − supply) | Cavity-surface reading | Verdict |
|---|---|---|---|---|---|---|
| 1 | Gate area | 60 °C | 63.5 °C | 3.5 °C | 62 °C | Normal — record and proceed |
| 2 | End of fill | 60 °C | 66.5 °C | 6.5 °C | 68 °C | Investigate — flow restriction or fouling suspected |
| 3 | Thick section | 60 °C | 63.0 °C | 3.0 °C | 61 °C | Normal — record and proceed |
Circuit 2 is the point of the table: same setpoint, same supply, but a 6.5 °C rise and a cavity surface 6–7 °C hotter than the other circuits. That circuit gets a flow check before the next run, not a setpoint change. No generic ΔT limit is stated here — the only published thresholds found came from a Chinese supplier site and were not used — so the acceptance limit for ΔT and for cavity-surface spread must be stated by the molder for this mold, and recorded in the same map.
Reproducible location- and time-defined thermal measurements connect the cooling system to the part and make transfers defensible. cooling-circuit acceptance guide defines the flow, leakage and temperature checks that produce those measurements.