
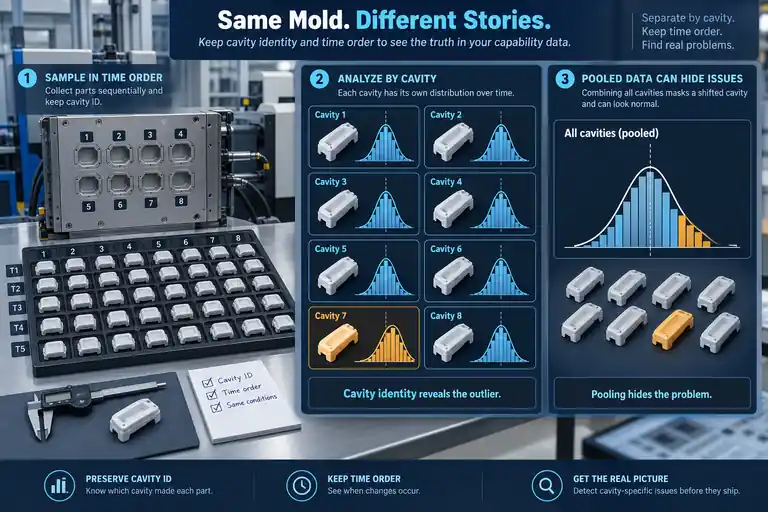
One capability number can look reassuring while hiding a shifted cavity, a startup trend, mixed measurement methods or a short hand-picked sample. For a multi-cavity mold, the calculation is only as meaningful as the population it represents and the stability, traceability and distribution assumptions behind it.
Before accepting Cpk or Ppk, agree the characteristic and specification, measurement method, part condition, cavities, sample sequence, production duration and subgroup logic. Review plots and cavity-specific results before any pooled summary. Cpk is normally interpreted for a stable process using within-process variation; Ppk uses overall observed variation. Neither index repairs unstable, non-normal, mixed or selectively sampled data, and no universal automotive acceptance threshold should be assumed.
Freeze the characteristic and data population
Record drawing revision, characteristic identifier, units, specification limits and any target. Define datum setup, fixture, instrument program, environmental condition and time after molding. Flexible or moisture-sensitive parts can produce different datasets under different restraint or conditioning. Confirm the measurement system is adequate for the intended decision before calculating an index.
Define the population in plain language: production-intent resin and color, mold revision, machine and process state, all active cavities, shifts, operators and time span. If data covers only a tool trial, call it trial evidence. If it covers a stable serial period, state that period. Do not combine before-and-after adjustment readings or different measurement programs into one distribution.
Preserve cavity identity and time order
Each molded part should retain cavity and sequence or timestamp. Plot the readings in production order for each cavity. Look for warm-up movement, cycles after interruption, trends, steps, alternating patterns and isolated events. Then compare cavity means and spreads. A pooled histogram destroys much of this diagnostic evidence.
If cavities are intentionally sampled in subgroups, explain the subgroup logic. Parts from one shot reveal cavity-to-cavity behavior at a moment; repeated parts from one cavity reveal time behavior. These answer different questions. A balanced sampling matrix should prevent a high-output or convenient cavity from dominating the result. Disabled cavities and sorted parts must be disclosed, not silently removed.
Establish stability before capability claims
NIST defines a stable process as one with constant mean and variance over time and states that capability discussion follows stability assessment. Use appropriate control charts or time plots, investigate special causes, and document any exclusions. If the process changes during collection, a single Cpk is not a faithful summary.
Capability compares observed process behavior with specifications. Cpk incorporates centering relative to limits using an estimate of within-process variation; Ppk uses overall variation across the observed population. Software settings for sigma estimation, subgroup size and distribution model affect the number. The report must disclose them. A high index from a small or filtered sample carries more uncertainty than its decimal places suggest. The process-window validation guide explains how to design the experimental runs that produce the data behind the index.
Report the index together with its context. The table below states the thresholds as program examples from the qhubio capability guide — they are the most commonly quoted launch/ongoing targets, not a universal rule; the customer’s own requirement governs.
| Stage | Per-cavity target (program example) | Sample basis |
|---|---|---|
| Launch / PPAP | Cpk ≥ 1.67 per cavity | 25 per cavity minimum, stable process |
| Ongoing production | Cpk ≥ 1.33 per cavity | Continued sampling with control charts |
| Any stage | Ppk reported alongside per-cavity Cpk | Pooled value shown for information only |
A Cpk of 1.67 from one cavity and a Cpk of 1.33 from another are not the same assurance; the lower value is the capability of the mold.
Handle pooled and non-normal data carefully
Pooled multi-cavity data can appear wider because cavity means differ, or can obscure one poor cavity when most cavities are centered. Report each cavity’s count, mean, spread, minimum, maximum, stability assessment and index where justified. A combined value may support overall shipment understanding, but it should not replace cavity results.
Inspect histograms, probability plots and time data rather than automatically transforming until an index passes. Bounded, rounded, mixed or multimodal data may violate normal assumptions. When an alternate distribution or nonparametric method is appropriate, pre-agree the method and explain it. For unilateral limits, use the corresponding one-sided logic and verify the physical meaning of the limit.
Make the report support a release decision
A credible report contains raw readings or an accessible data file, sample map, cavity IDs, timestamps, rejected or excluded point rationale, measurement-system reference, calculation formulas or software settings, plots, stability conclusion and signed disposition. It also states what process and material conditions were held.
The customer should define required characteristics, study timing and acceptance criteria. Some programs specify capability targets through customer-specific documents; these are not universal industry law. If a cavity misses the agreed criterion, the response may be steel correction, process centering, measurement review, containment or further data—chosen from evidence, not by pooling until the number improves.
Evidence worksheet for the sourcing or release review
Record the membership and collection times of a real proposed subgroup. Use those records to decide what its within-subgroup variation represents before selecting a chart or capability calculation.
| Evidence line | What the reviewer should be able to verify |
|---|---|
| 1. released feature, limits, units and target | The feature identifier, drawing revision, units, upper/lower or one-sided limits and customer target match the calculation. |
| 2. measurement fixture, program and part condition | The same fixture/program, restraint, conditioning and measurement timing apply; measurement-system evidence supports resolving the observed variation. |
| 3. complete cavity and time identification | Every reading retains cavity, shot/time and sample status; omitted or disabled cavities and exclusions are declared. |
| 4. production-intent material and process state | The study identifies resin/color, mold, press, settings and production period; adjustments and separate process states are not silently pooled. |
| 5. subgroup and sampling rationale | The record lists which observations form each subgroup, their timing and common conditions, and why the selected sigma estimator fits that structure. |
| 6. stability plots and special-cause review | Per-cavity time plots or appropriate charts address trends, steps and special causes before any predictive capability claim. |
| 7. raw data plus disclosed calculation method | Raw values, subgroup IDs, exclusions, software settings, sigma estimate and distribution model allow the reported result to be reproduced. |
| 8. cavity-specific and justified pooled conclusions | Each cavity has a supported conclusion; pooling has a stated purpose and does not replace disposition of a weak cavity or unstable interval. |
Questions that expose weak assumptions
| Question | A useful supplier answer should include |
|---|---|
| What exact population does this number represent? | The named feature and revision, material/process state, cavities, shifts and dates; trial-only data is labeled as such. |
| Were all active cavities sampled evenly and in time order? | A cavity-by-time sampling map with counts, sequence and all exclusions; a pooled total alone cannot show coverage. |
| Was stability demonstrated before Cpk was interpreted? | Time-order plots or control charts, investigated signals and the basis for any exclusions; a histogram alone is insufficient. |
| Which sigma estimate and distribution assumptions were used? | Within-subgroup versus overall estimation, subgroup membership/size and distribution or one-sided method, including software options. |
| Can the reviewer reproduce the result from raw readings? | The original data file, calculation settings, specification limits and any rounding/filter rules, together with the released output. |
| What action follows a weak cavity or unstable period? | Containment and diagnosis tied to the pattern, followed by an agreed repeat study after correction; no pooling to conceal the failing cavity. |
Illustrative example
An eight-cavity tool produces 25 measurements per cavity. Seven cavity means are near target; one is shifted toward the upper limit. The pooled histogram still looks broadly acceptable because the other 175 readings dominate.
Worked calculation: the same 8-cavity example, with numbers
The values below are illustrative only — they complete the article’s own example so the arithmetic can be checked, and must be replaced by the mold’s real measurement data. Specification: 10.00 ± 0.10 mm, so LSL = 9.90 mm and USL = 10.10 mm. Each cavity contributes 25 measurements (200 total).
| Cavity | Mean (mm) | Within-cavity s (mm) | Cpk |
|---|---|---|---|
| 1–7 (each) | 10.00 | 0.02 | 1.67 |
| 8 | 10.06 | 0.02 | 0.67 |
Cavity 8’s Cpk: Cpu = (10.10 − 10.06) / (3 × 0.02) = 0.04 / 0.06 = 0.67; Cpl = (10.06 − 9.90) / 0.06 = 2.67; Cpk = min(0.67, 2.67) = 0.67. Cavities 1–7: Cpk = 0.10 / (3 × 0.02) = 1.67.
Now pool all 200 readings. The grand mean is (7 × 25 × 10.00 + 25 × 10.06) / 200 = 10.0075 mm. The overall standard deviation is 0.02817 mm. Ppu = (10.10 − 10.0075) / (3 × 0.02817) = 1.094; Ppl = (10.0075 − 9.90) / (3 × 0.02817) = 1.272; Ppk = 1.09.
The pooled Ppk of 1.09 looks acceptable and hides cavity 8’s 0.67 entirely — cavity 8’s mean sits only two standard deviations from the upper limit, so about 2 in 100 parts from that cavity fall out of spec, while the pooled index passes. Report per cavity first, then the pooled value, and never accept a pooled index alone. (Arithmetic verified 2026-11-18; parent re-verified: Cpk 0.67/1.67, grand mean 10.0075, SD 0.02817, Ppk 1.09.)
Cavity-separated time plots reveal the location-specific offset, while repeat measurements confirm it is not fixture loading. The team addresses that cavity and repeats the agreed study instead of citing the pooled number as release evidence.
What to send for a project-specific review
For a capability review, send the raw readings with cavity/time/subgroup IDs, drawing limits, measurement method, part conditioning, process history and calculation settings through the project RFQ. Include the customer’s required study scope and acceptance criteria.
Use uncertainty and failure pattern before acting on an index
Every index is an estimate. Sample count, autocorrelation, rounding, gauge resolution and the selected variation estimator affect uncertainty. Avoid treating the second decimal place as physical certainty, and remember that a long but biased sample does not become representative.
If results cluster on a few rounded values, review gauge discrimination and data export. Do not remove points simply because capability improves. Exclusion needs a supported special cause, affected-population disposition and a report that preserves both original and revised analysis.
Connect patterns to action: excessive spread, off-center but tight behavior, cavity-to-cavity offsets and time trends require different investigation. These signals matter more than arguing about Cpk and Ppk in isolation. For persistent location-specific differences, investigate runner balance and cavity variation alongside the measurement and tool evidence. Pooling is never a substitute for resolving a weak cavity.
Define ongoing review from customer requirements, characteristic risk, stability history and changes. Preserve lineage between launch and serial studies. When a customer specifies a threshold or format, cite that controlled requirement; do not present it as a universal automotive rule.
Retain the software configuration and calculation output used for every released result so a later reviewer can reproduce the number from the preserved raw readings.
References
- NIST: assessing process stability
- NIST: what is process capability?
- NIST: assessing process capability
- Minitab guidance on rational subgroups and variation
- qhubio — Injection Molding Cpk Requirements (per-cavity reporting; report the worst cavity; launch/ongoing threshold examples): https://qhubio.com/injection-molding-cpk-requirements
- Elsmar — Capability on Parallel Processes such as Individual Mould Cavities (each cavity its own process stream; 4–5 samples per cavity, about 100 total): https://elsmar.com/elsmarqualityforum/threads/capability-on-parallel-processes-such-as-individual-mould-cavities.50845/