
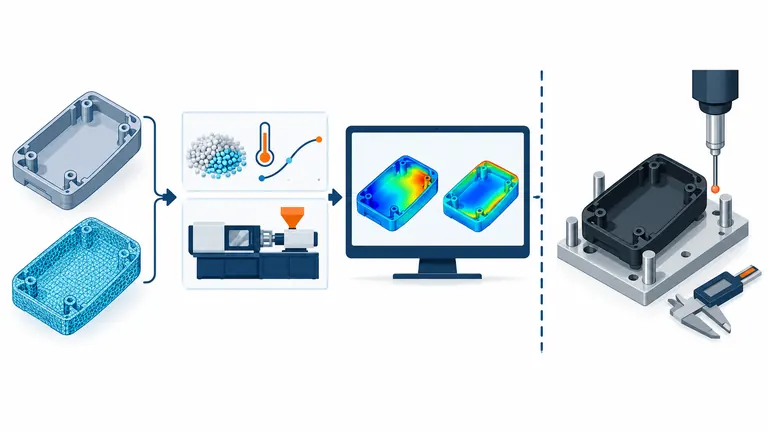
Conceptual illustration; not to scale.
A Moldflow report can make a tooling decision more transparent, but it can also create false confidence when the resin dataset, mesh, machine, runner, cooling layout, or process settings do not represent the intended build. A result is only as useful as the question, inputs, model boundary, and verification plan behind it.
Use Moldflow to compare and investigate filling, packing, cooling, warpage, fiber orientation, pressure demand, weld-line and air-trap locations, and design alternatives within the selected analysis sequence. Do not treat it as proof that production parts will meet every drawing, appearance, assembly, durability, or system requirement. Review inputs and uncertainty, then correlate important predictions during tool trials.
Define the decision and analysis sequence first
“Run Moldflow” is not an engineering objective. State the decision the team needs to make: choose a gate location, compare wall changes, estimate pressure demand, assess hesitation, improve runner balance, review cooling layout, understand warpage drivers, or compare fiber orientation near a loaded feature. The objective determines the geometry, material data, mold detail, process controls, result plots, and sensitivity cases required.
Autodesk’s Moldflow feature description distinguishes filling, packing, cooling, and deflection capabilities. Autodesk’s tutorials further explain that fill analysis is the foundation, pack focuses on packing and shrinkage, cool evaluates the mold cooling system, and warp uses results from cooling, filling, and packing. A fill-only study cannot support the same conclusions as a coupled Cool+Fill+Pack+Warp study.
Write a question-and-output table before the analyst begins. For gate selection, request fill pattern, pressure demand, temperature at flow front, weld and air-trap locations, and sensitivity to plausible process settings. For cooling, include the actual channel concept, coolant conditions, mold materials, inserts, and cycle assumptions. For warpage, define how distortion will be measured relative to assembly datums or surfaces; a global displacement plot may not answer a local flatness or hole-position question.
Also define comparison logic. Simulation is often stronger for comparing controlled design alternatives than for promising an absolute production number. Autodesk’s warpage guidance notes that comparing changes between studies is different from comparing one result directly with a tolerance. Record which inputs remain constant across cases and which single variable changes, otherwise an apparent improvement cannot be attributed to the proposed design change.
Audit geometry, mesh, material, machine, and process inputs
Start with the exact part revision and identify what has been simplified. Include gates, runners, sprues, hot-runner drops, inserts, and cooling features when they affect the objective. If a runner is omitted and replaced by an idealized gate, the pressure and thermal path begin at a different boundary. If a family mold is modeled as one isolated cavity, interaction and balance questions remain unanswered.
Mesh suitability must be reported, not assumed. Autodesk states that analysis accuracy depends heavily on correct element sizing and mesh quality. Thin sections, ribs, bosses, abrupt thickness transitions, gates, and complex three-dimensional flow can require local refinement or a different mesh approach. Ask for the mesh type, element statistics, diagnostics, corrections, and evidence that critical features are represented.
Use the exact commercial resin grade where possible. Autodesk’s Material Quality Indicators connect confidence to viscosity, thermal, pvT, mechanical, and shrinkage data. A generic polymer substitute may support an early directional comparison but should be labeled as an assumption. Fiber content, color/additive package, moisture state, recycled content, and supplier-specific grade can influence processing and shrinkage behavior.
Enter realistic machine and process limits. Review melt and mold temperatures, flow-rate or fill-time control, velocity-to-pressure transfer, pressure limits, packing profile, cooling time, screw or shot capability, clamp force, and coolant conditions. A simulation that reaches the target fill only by exceeding the selected press or resin limits is not a viable production proposal. Conversely, a conservative machine limit should be identified so the team can decide whether the constraint belongs to the part, mold, or intended cell.
What the results can support
Fill results can show the predicted progression of the flow front, identify hesitation and race-tracking tendencies, compare gate locations, and show likely last-to-fill regions. Autodesk’s fill-time interpretation guidance explains how closely spaced contours may indicate hesitation and how weld lines and air traps can be overlaid. These outputs help prioritize venting, wall, gate, and trial observations; they do not prove weld strength or cosmetic acceptance.
Pack analysis can compare pressure transmission, volumetric shrinkage tendency, and the effect of gate freeze and packing strategy. Cooling analysis can compare channel layouts, mold temperatures, hot spots, and cooling-time drivers. Autodesk describes the mold as a heat exchanger and links uniform cooling to distortion control. These results are useful when the modeled channel geometry, mold materials, coolant conditions, and cycle boundary resemble the proposed tool.
Warp analysis can identify predicted distortion patterns and separate contributing mechanisms such as differential cooling, differential shrinkage, and orientation effects, depending on material and analysis setup. For a glass-filled housing, fiber-orientation output can support structural handoff and gate comparisons. It is still necessary to define the assembly coordinate system, fixture condition, and functional surfaces. A visually dramatic displacement scale does not by itself establish whether the part will assemble or seal.
Pressure, clamp-force, and cooling estimates can support machine and capacity discussions, but review how the machine nozzle, feed system, safety factors, and cycle elements were represented. Use results to identify constraints and compare cases. Do not copy a simulated cycle directly into a commercial quote without accounting for mold opening, ejection, automation, insert loading, inspection, stabilization, and real production losses.
What Moldflow does not approve
Moldflow does not approve the drawing, material, mold, process, or production shipment. It does not replace dimensional inspection, appearance review, assembly trials, leak or ingress testing, retention-force tests, electrical safety work, environmental aging, durability, capability studies, packaging validation, or customer PPAP. Those activities answer different questions and often include the complete component or system.
A predicted weld-line location is not a weld-line strength result unless an appropriate validated structural method and material model are used. A predicted air trap is not proof of burn marks, and an absent predicted trap does not prove venting is adequate. A warpage value is not automatically comparable with a drawing tolerance unless the datum, alignment, constraint, conditioning state, and measurement definition match. A material’s database record is not proof that the molded component meets a customer requirement.
The software also cannot correct uncertain inputs. Unknown steel temperatures, guessed packing pressure, generic shrinkage data, missing cooling channels, or an idealized gate remain uncertainties even when the solver converges. Ask the analyst to mark assumed, measured, supplier-provided, and design-controlled inputs. Run sensitivities on assumptions likely to change the tooling decision rather than presenting one nominal case as certainty.
Nor does simulation establish production repeatability. Real machines, hot runners, cavity tolerances, check valves, dryers, cooling circuits, operators, material lots, and ambient conditions vary. Simulation can help design a wider process window, but the process window must be challenged on the production-intent tool and machine. The run-at-rate article explains how sustained output and evidence differ from a short successful trial.
Review the report with an evidence checklist
| Review item | What the report should state | Decision it supports |
|---|---|---|
| Objective | Question, alternatives and acceptance logic | Whether the study answers the project need |
| Revision/model | CAD revision, included geometry and simplifications | Configuration control and boundary |
| Mesh | Type, density, diagnostics and local treatment | Whether critical geometry is represented |
| Material | Exact grade, data source and quality/assumptions | Confidence in fill, pack and warp results |
| Machine/process | Limits, temperatures, control profile and cooling | Feasibility on the intended cell |
| Results | Units, scale, locations and comparison basis | Gate, wall, runner, cooling or process choice |
| Sensitivity | Plausible ranges that can change the conclusion | Robustness of the recommendation |
| Trial correlation | Features and measurements to check in steel | How predictions will be verified |
Illustrative example: a housing study predicts acceptable global warpage but the drawing controls a connector face relative to two mounting datums. Ask for deflection resolved in that datum system, the assumed material shrinkage data, cooling layout, and assembly constraint. Then specify trial measurements on the free part and the intended assembly fixture. The revised analysis may still support the design, but now it answers the actual acceptance question.
Before commissioning a study, provide the STEP model, 2D drawing and datums, exact resin grade, target machine, gate and runner concept, cooling proposal, critical and cosmetic regions, process limits, and decisions to be made. Use the AutoMoldingPro DFM and Moldflow service page to frame a project-specific review, and plan from the start how important predictions will be checked during trials.